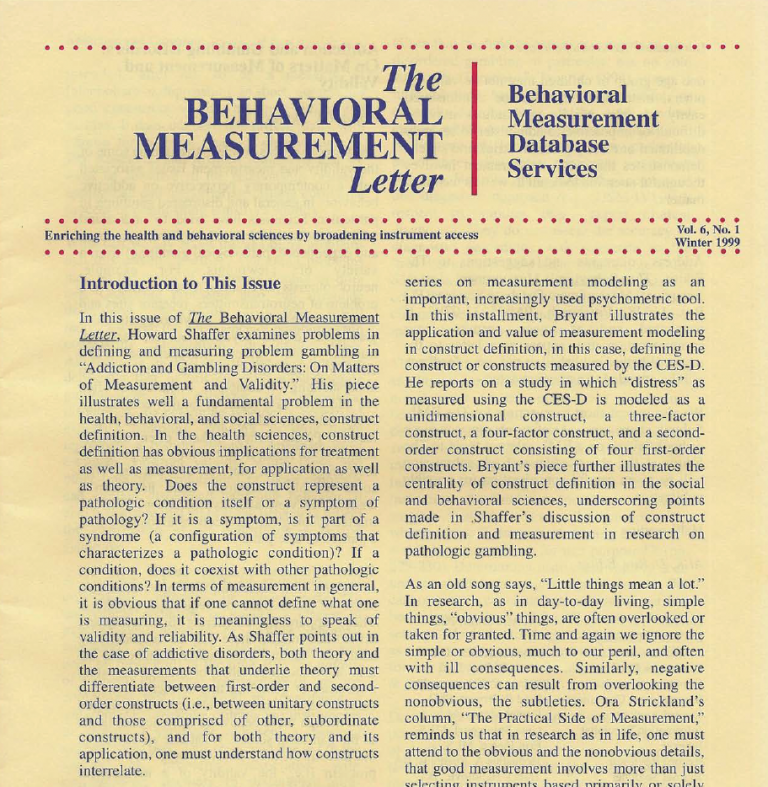
Continued article from the The Behavioral Measurement Letter, Vol. 6, No.1 Winter 1999
Measurement Modeling: Identifying the Constructs Underlying the Center for Epidemiologic Studies Depression Scale (CES-D)
Fred B. Bryant, PhD
In a previous column (Bryant, 1998), I described a powerful, new data-analytic approach to construct validation known as “measurement modeling.” This approach uses state-of-the-art multivariate statistical tools to systematically compare alternative ways of conceptualizing the constructs that a particular research instrument taps. By fine-tuning our understanding of what instruments actually measure, measurement modeling: (a) better enables one to choose the most appropriate instruments for the intended purpose; (b) improves conceptual clarity by identifying constructs that are truly unitary and by decomposing multidimensional constructs into their constituent parts; (c) highlights gaps in measurement coverage for instrument development; (d) often leads to refinements in existing instruments, creating modified measures with improved conceptual and statistical precision; and (e) identifies how to score responses to instruments so as to capture the underlying construct(s) with maximum reliability. In the present column, I describe a published example of measurement modeling (Sheehan, Fifield, Reisine, & Tennen, 1995) that was conducted on one of the most popular measures of distress used in the behavioral sciences, the Center for Epidemiologic Studies Depression Scale (the CES-D; National Institute of Mental Health, 1977; Radloff, 1977). Here I describe how the researchers used measurement modeling to improve understanding and future use of the CES-D.
To review the basics as I covered them in previous columns (Bryant, 1997, 1998), measurement modeling, also known as confirmatory factor analysis, is a special form of structural equation modeling that investigates the “structure” underlying a set of measures collected from a group of people. “Structure” refers to the ways in which responses to the individual measures interrelate (if they do) to define one or more underlying constructs (factors). Questions that strongly reflect a particular factor are said to have strong “loadings” on that factor or to “load” highly on that factor. In other words, each question’s loading on a particular factor indicates how strongly that question defines the underlying construct that that factor taps. Thus, through measurement modeling, researchers can: (a) determine the appropriate number of constructs or factors underlying responses to a set of measures; (b) determine how these factors relate to one another; (c) quantify how strongly each measure characterizes each underlying factor, thereby pinpointing the specific subsets of questions that define the constructs; and (d) interpret the meaning of each factor in order to label each construct in theory-relevant terms. Moreover, measurement modeling enables researchers to compare competing models of the constructs that an instrument assesses, determine which model best explains responses to the instrument, and test whether the structure of responses to an instrument is stable across multiple groups or multiple time points.
The following summary of research on the CES-D illustrates measurement modeling and its value. The CES-D consists of 20 questions that reflect various symptoms of depression, including negative mood, feelings of guilt, worthlessness and helplessness, immobilization, poor appetite, and sleep disturbance. Respondents report the frequency with which each symptom occurred during the previous week using a four-point scale as follows: 0 (“rarely, that is, less than 1 day”); 1 (“some of the time, 1 to 2 days”); 2 (“a moderate amount of the time, 3 to 4 days”); and 3 (“most or all of the time, 5 to 7 days”). Although the CES-D is widely used to measure distress in the general population and among patients with chronic disease, there is no agreement about the underlying construct(s) that it taps. On the one hand, many investigators have treated the CES-D as measuring a single underlying construct (i.e., a unidimensional measurement model), and when coding responses to the instrument have simply summed responses to all questions to obtain a global “total score.” However, in initially developing the CES-D, Radloff (1977) identified four constructs (i.e., a multi-dimensional model) that underlie responses to the instrument which she labeled Depressed Affect, Low Positive Affect, Somatic Symptoms and Retarded Activity, and Impaired Interpersonal Relations. Other researchers have argued that the Depressed Affect and Low Positive Affect factors really reflect a single underlying construct, and therefore treated the CES-D as measuring three underlying constructs consisting of affect (combining Depressed Affect and Low Positive Affect) and the somatic/vegetative symptoms and interpersonal deficits that Radloff originally found.
Which of these measurement models best explains responses to the CES-D, and is this measurement model equally reliable in assessing the same individuals over time? Sheehan, Fifield, Reisine, and Tennen (1995) set out to answer these questions. They began with data from a sample of 813 rheumatoid arthritis patients who completed the CES-D as part of a telephone interview once a year for three years. To analyze these data, Sheehan, et al. decided to use the most popular software program for conducting measurement modeling – LISREL 8, the LInear Structural RELationships computer analysis package, version 8. They used LISREL 8 to impose four alternative measurement models on the CES-D data: (a) a single-factor (total score) model that assumes depression is unidimensional (Model 1); (b) a three-factor model that assumes that the CES-D taps interrelated dimensions of affect, somatic/vegetative symptoms, and interpersonal deficits (Model 2); (c) a four-factor model that assumes the CES-D taps correlated dimensions of depressed affect, low positive affect, somatic/ vegetative symptoms, and interpersonal deficits (Model 3); and (d) a second-order factor model consisting of the same four factors as in Model 3 but with a single higher-order depression construct that explains the relationships among the four lower-order factors (Model 4). This latter model hypothesizes that the four first- order factors are correlated with one another and thus their interrelationships can be explained by a second-order “super” factor that influences each dimension.
Sheehan et al. used LISREL 8 to compare how well each of these four measurement models explains responses to the CES-D. They began by analyzing the data from the first of the three data collection points. LISREL 8 revealed that although the single-factor model provided a reasonable fit to time 1 data, the three-factor, four-factor, and second-order factor models all fit time I data significantly better. Furthermore, both the four-factor model and second-order factor model provided a significant improvement in fit over the three-factor model, though the former two models were not significantly different from one another in their goodness-of-fit.
Having compared the fit of the four alternative models at time 1, Sheehan, et al. (1995) next conducted analyses to cross-validate the four- factor and second-order factor models across all three time points. Examining the four-factor model, they found that it had equivalent factor loadings and equivalent correlations among its factors across all three time points. In addition, the amount of variance that the four-factor model explained in each CES-D question was equivalent over time. An identical pattern of results emerged for the second-order factor model. As Sheehan, et al. emphasized, the stability of these models over time in no way implies that people’s responses to the CES-D questions will necessarily be stable over time. Rather, it means that the measurement structure underlying responses to the CES-D is equally reliable across time. In other words, the meaning of distress is stable over time. This finding is important for researchers who use the CES-D in longitudinal research, because it demonstrates the validity of using the same four factors to score the instrument at each point in time.
Sheehan, et al.’s (1995) results indicate that the four-factor model is the most appropriate way of scoring the CES-D to measure depressive symptoms because it is psychometrically superior to the commonly used “total score” method. Their work further indicates that although a single “total score” provides a fairly reliable summary of global distress, it ignores the fact that respondents use the CES-D questions to describe four separate, though correlated, forms of negative experience: depressed affect, low positive affect, somatic/ vegetative symptoms, and interpersonal deficits. People may not simply report more or less intensity in their distress, but may have more or less of particular types of depressive symptoms. Moreover, and of potential clinical significance, summarizing the CES-D in terms of a total score equates people who are higher on one dimension and lower on another dimension with people who are lower on the former and higher on the latter. In addition, it is possible for CES-D total score to decrease over time while distress along one particular dimension might actually increase; for example, a person might experience less negative affect over time but also experience less positive affect as well. Simply lumping together these multiple dimensions is not the most informative index of distress and may, in fact, produce misleading results.
The work of Sheehan, et al. (1995) illustrates how measurement modeling helps us better understand the constructs that instruments measure, determines the most reliable and informative method of scoring instruments so as to maximize conceptual clarity and statistical accuracy, and thus enables us to use instruments more effectively. Given its demonstrated value, measurement modeling is an indispensable psychometric tool in the behavioral sciences.
References
Bryant, F.B. (1997). The comparative anatomy of related instruments: An emerging specialty. The Behavioral Measurement Letter, 4 (2), 7-9.
Bryant, F.B. (1998). Measurement Modeling: A tool for investigating the comparative anatomy of related instruments. The Behavioral Measurement Letter, 5 (2). 14-17.
National Institute of Mental Health. (1977). Center for Epidemiologic Studies Depression Scale (CES-D). Rockville, MD: Author.
Radloff, L.S. (1997), The CES-D Scale: A self-report depression scale for research in the general population. Applied Psychological Measurement, 1, 385-401.
Sheehan, T.J., Fifield, J., Reisine, S., & Tennen, H. (1995). The measurement structure of the Center for Epidemiologic Studies Depression Scale. Journal of Personality Assessment, 64, 507-521.
Fred Bryant is Professor of Psychology at Loyola University, Chicago. He has roughly 80 professional publications in the areas of social psychology, personality psychology, measurement, and behavioral medicine. In addition, he has coedited 5 books, including Methodological Issues in Applied Social Psychology (New York, Plenum Press, 1993). Dr. Bryant has extensive consulting experience in a wide variety of applied settings, including work as a research consultant for numerous marketing firms, medical schools, and public school systems; a methodological expert for the U.S. Government Accounting Office; and an expert witness in several federal court cases involving social science research evidence. He is currently on the Editorial Board of the journal Basic and Applied Social Psychology. His current research interests include happiness, psychological well-being, Type A behavior, the measurement of cognition and emotion, and structural equation modeling.
Read additional articles from this newsletter:
Addiction and Gambling Disorders: On Matters of Measurement and Validity
The Practical Side of Measurement
6-2-fall-1999
